|
|
|
|
|
|
Jan2017
SUMMARY ANALYSIS: JANUARY 2017
TOTAL INTERNATIONAL TOURIST ARRIVALS
A total of 1 040 534 international tourist arrivals were recorded for January 2017, which is an increase of 2.8% (27 893) compared to the same month of the previous year (see Figure 1 and Table 1). Figure 1: Total International Tourist Arrivals Jan 2017 vs. Jan 2016 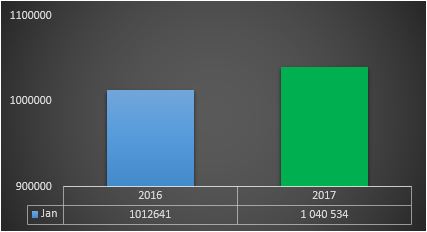
REGIONAL TOURISM PERFORMANCE Table 1 provides the regional tourism performance for South Africa's international tourist arrivals. December 2016 compared to January 2017 Comparing January 2017 to December 2016 (refer to Table 1) there was a 7.8%
(75 427) increase in international tourist arrivals in January 2017 compared to December 2016. Performance by Region shows that the Middle East increased by 28.1% followed by Asia (18.8%), South America (11.4%), and Africa (Air and Land) by 13%. There was a decline in Australasia (37.3%), North America (24.7%) and Europe (3.7%). Table 1: Comparison of international tourist arrivals by regions | | December 2016 compared to January 2017 | | Jan 2016 Compared to Jan 2017 | | Region | December 2016 | January 2017 | January 2016 | | EUROPE | 167 173 | 160 913 | 142 033 | | NORTH AMERICA | 38 148 | 28 734 | 26 962 | | CENTRAL & SOUTH AMERICA | 9 314 | 10 375 | 5 332 | | AUSTRALASIA | 16 022 | 10 052 | 10 023 | | ASIA | 24 129 | 28 675 | 25 007 | | MIDDLE EAST | 4 938 | 6 325 | 5 546 | | AFRICA (Air and Land) | 701 458 | 792 669 | 794 656 | | OVERSEAS TOTAL | 259 724 | 245 074 | 214 903 | | TOTAL AFRICA (Total Africa Land+ Africa Air+ Indian Ocean Islands) | 704 297 | 794 677 | 797 050 | | GRAND TOTAL | 965 107 | 1 040 534 | 1 012 641 |
January 2017 compared to January 2016 When comparing January 2017 to January 2016, an increase in international tourist arrivals is evident for most regions. International tourist arrivals from overseas increased by 14% (from 214 903 to 245 074) while international tourist arrivals from Total Africa declined by 0.3% (from 797 050 to 794 677). Central and South America increased by 94.6%, followed by Asia (14.7%), Middle East (14%), Europe (13.3%) and North America (6.6%). Africa (including air and land regions) declined by 0.3%. Table 2: South Africa's Top 20 Source Markets: January 2017 vs. January 2016 | | JANUARY 2016 | | JANUARY 2017 | | | | | Rank | Country | Tourist Arrivals | Country | Tourist Arrivals | % Growth | Rank | | 1 | Zimbabwe | 250 514 | Zimbabwe | 244 966 | -2.2 | 1 | | 2 | Lesotho | 209 403 | Lesotho | 227 031 | 8.4 | 2 | | 3 | Mozambique | 145 775 | Mozambique | 137 972 | -5.4 | 3 | | 4 | Swaziland | 75 176 | Swaziland | 72 685 | -3.3 | 4 | | 5 | UK | 46 264 | UK | 48 165 | 4.1 | 5 | | 6 | Botswana | 44 458 | Botswana | 40 604 | -8.7 | 6 | | 7 | Germany | 28 944 | Germany | 33 413 | 15.4 | 7 | | 8 | USA | 21 786 | USA | 23 289 | 6.9 | 8 | | 9 | Namibia | 17 033 | France | 15 725 | 34.1 | 9 | | 10 | Zambia | 13 758 | Namibia | 15 711 | -7.8 | 10 | | 11 | Malawi | 12 282 | Malawi | 14 856 | 21 | 11 | | 12 | Netherlands | 11 980 | Netherlands | 14 346 | 19.7 | 12 | | 13 | France | 11 728 | Zambia | 13 404 | -2.6 | 13 | | 14 | China (including Hong Kong) | 9 420 | China (including Hong Kong) | 12 083 | 28.3 | 14 | | 15 | Australia | 8 508 | Australia | 8 762 | 3.0 | 15 | | 16 | India | 6 638 | Sweden | 7 233 | 28.6 | 16 | | 17 | Sweden | 5 625 | Switzerland | 6 554 | 20.8 | 17 | | 18 | Angola | 5 565 | India | 6 293 | -5.2 | 18 | | 19 | Switzerland | 5 424 | Brazil | 6 114 | 113 | 19 | | 20 | Nigeria | 5 381 | Angola | 5 720 | 2.8 | 20 |
Comparing January 2017 with January 2016, Zimbabwe remained the largest African source market for international tourist arrivals for South Africa while Namibia dropped from the 09th to 10th position and Zambia from 10th to 13th position. Angola became a new entry replacing Nigeria in the top 20 source markets in January 2017. For the Overseas source markets for international tourist arrivals, January 2017 compared to January 2016, the United Kingdom (UK) remained the largest overseas market while France replaced Namibia by moving up from the13th to 09th position. Sweden moved up from the 17th to 16th position, Switzerland from 19th to 17th position, India dropped from the 16th to 18th position and China (including Hong Kong) from the 15th to 16th in the top twenty countries' list. In addition, Brazil moved into the top 20 markets as South Africa's 19th largest source market for international tourist arrivals.
Jul-Sep2016
SUMMARY ANALYSIS JULY 2016
TOTAL TOURIST ARRIVALS
A total of 822 416 tourist arrivals were recorded for July 2016, which is an increase of 12.2% (89 525) compared to the same month of the previous year (refer to figure 1 below). There was an increase of 131 002 tourists in July 2016 compared to June 2016. This brings the total tourist arrivals for the period January-July 2016, to 5 791 504, which is an increase of 14.9% (751 388) compared to the same period of the previous year.
Figure 1: Total Tourist Arrivals Jan-July 2015 versus Jan-July 2016 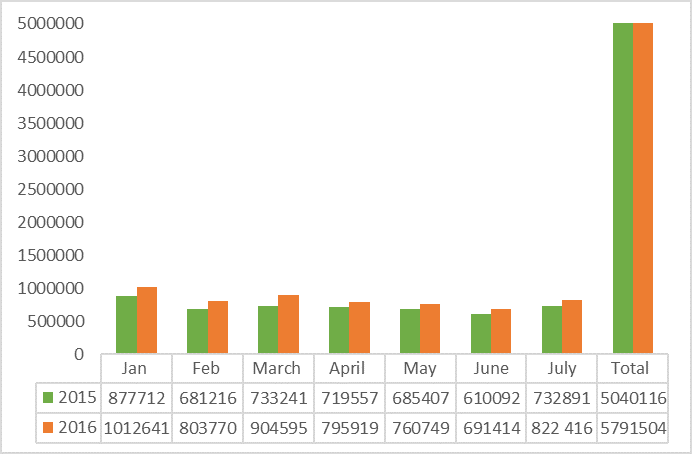
Table 1 below shows that all regions experienced an increase in tourist arrivals in July 2016 compared to June 2016. When comparing July 2016 with July 2015, an increase in tourist arrivals is evident for all regions: Asia increased by 47.7%, followed by Middle East (35.1), North America (26.1%), Central and South America (24.4%), Europe (17.5%), Australasia (16.4%). The least increase was recorded in Total Africa including Indian Ocean Islands (9%).
|
June2016 compared to July 2016
|
|
July 2015 Compared to July 2016
|
Jan-July 2016 compared to Jan-July 2015
|
|
|
Region |
June
2016
|
July
2016
|
July
2015
|
Jan-July 2016 |
Jan-July 2015 |
| EUROPE |
58104 |
106690 |
90775 |
804063 |
698667 |
| NORTH AMERICA |
34631 |
41069 |
32580 |
234068 |
196677 |
| CENTRAL & SOUTH AMERICA |
3661 |
6029 |
4848 |
33400 |
28239 |
| AUSTRALASIA |
10318 |
11759 |
10104 |
70452 |
63067 |
| ASIA |
25857 |
27711 |
18768 |
189368 |
133625 |
| MIDDLE EAST |
3209 |
7643 |
5658 |
39698 |
28978 |
| OVERSEAS TOTAL |
135780 |
200901 |
162733 |
1371049 |
1149253 |
| TOTAL AFRICA |
554811 |
618292 |
569139 |
4413946 |
3883625 |
| GRAND TOTAL |
691414 |
822416 |
732891 |
5791503 |
5040116 |
TOURIST MARKETS
Table 1: Total Tourist Arrivals by Region July 2016
Table 2 shows that all South Africa's major overseas markets performed well in July 2016. Amongst traditional overseas markets, the USA grew by 19.8%, while Germany increased by 21.1% and the UK by 11.7% from Jan-July 2016. Non-traditional source markets like India (28.1%) and China (63.7%) also experienced growth during the same period.
| | July 2015 | | July 2016 | | | | Rank | Country | Tourist Arrivals | Country | Tourist Arrivals | Rank | | 1 | Zimbabwe | 158287 | Lesotho | 162392 | 1 | | 2 | Lesotho | 124988 | Zimbabwe | 145776 | 2 | | 3 | Mozambique | 98686 | Mozambique | 97910 | 3 | | 4 | Swaziland | 68271 | Swaziland | 80353 | 4 | | 5 | Botswana | 50671 | Botswana | 60788 | 5 | | 6 | UK | 29486 | USA | 36596 | 6 | | 7 | USA | 29076 | UK | 30937 | 7 | | 8 | Namibia | 17164 | Netherlands | 17503 | 8 | | 9 | Netherlands | 15326 | Namibia | 16386 | 9 | | 10 | Zambia | 14254 | Zambia | 15101 | 10 | | 11 | Malawi | 11962 | Malawi | 13414 | 11 | | 12 | Germany | 10609 | Germany | 13279 | 12 | | 13 | France | 8795 | France | 12315 | 13 | | 14 | Australia | 8242 | Australia | 9582 | 14 | | 15 | India | 6095 | China (including Hong Kong) | 8858 | 15 | | 16 | China (including Hong Kong) | 5402 | India | 7856 | 16 | | 17 | Nigeria | 4980 | Nigeria | 5869 | 17 | | 18 | Italy | 4181 | Belgium | 5332 | 18 | | 19 | Belgium | 4098 | Italy | 5281 | 19 | | 20 | Canada | 3504 | Canada | 4473 | 20 |
TOURIST MARKETS
Table 1: Total Tourist Arrivals by Region July 2016
Table 2 shows that all South Africa's major overseas markets performed well in July 2016. Amongst traditional overseas markets, the USA grew by 19.8%, while Germany increased by 21.1% and the UK by 11.7% from Jan-July 2016. Non-traditional source markets like India (28.1%) and China (63.7%) also experienced growth during the same period.
Table 2: South Africa's Top 20 Source Markets: July 2016 compared to July 2015
For July 2016, Lesotho was the largest African source market while the USA was the largest overseas source market for South Africa. Compared to July 2015, the Netherlands moved from the 9th to 8th source market replacing Namibia. China replaced India by moving from 16th place to become South Africa's 15th source market. Belgium replaced Italy, becoming South Africa's 18th source market. For overseas markets, the highest increase in tourists was from China (64%) moving from 5402 in July 2015 to 8858 in 2016. France also had an additional 3520 tourists visiting South Africa in July 2016 compared to July 2015 which is a 40% increase. Lesotho experienced the highest increase for the African markets with an additional 37 404 tourists which is a 29.9% increase from July 2015.
Aug2016
SUMMARY ANALYSIS: AUGUST 2016
TOTAL TOURIST ARRIVALS
A total of 833 638 tourist arrivals were recorded for August 2016, which is an increase of 14% (102 390) compared to the same month of the previous year (refer to figure 1 below). There was an increase of 11 222 tourists in August 2016 compared to July 2016. This brings the total tourist arrivals for the period January-August 2016, to 6 625 141, which is an increase of 14.8% (853 778) compared to the same period of the previous year.
Figure 1: Total Tourist Arrivals Jan-Aug 2016 versus Jan-Aug 2016 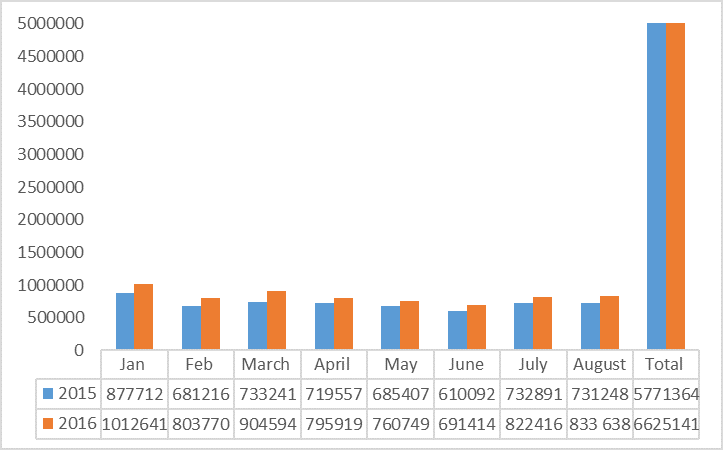
Table 1 below shows that all regions, except North America, and Central and South America, experienced an increase in tourist arrivals in August 2016 compared to July 2016.
When comparing August 2016 with August 2015, an increase in tourist arrivals is evident for all regions: Middle East increased by 55%, followed by Asia (37.9%), Central and South America (24.9%), Europe (22.3%) and Australasia (12.2%). The least increase was recorded in Total Africa (11.9%) and North America (10.4%). Interestingly, an increase in tourist arrivals is also recorded for all regions when comparing the period January-August 2016 with January-August 2015.
Interestingly, an increase in tourist arrivals is also recorded for all regions when comparing the period January-August 2016 with January-August 2015. Asia increased by 41.2%, Middle East (39.6%), Central and South America (19%), North America (17.9%), North America (15.9%) ad Total Africa (13.4%).
TOURIST MARKETS
Table 1: Total Tourist Arrivals by Region: August 2016
| |
July 2016 compared to August 2016
|
|
August 2016 Compared to August 2015
|
Jan-August 2016 compared to Jan-August 2015
|
|
|
Region |
July 2016 |
August
2016
|
August
2015
|
Jan-August 2016 |
Jan-August 2015 |
| EUROPE |
106690 |
116 643 |
95 406 |
920706 |
794 073 |
| NORTH AMERICA |
41069 |
33 425 |
30 280 |
267493 |
226 957 |
| CENTRAL & SOUTH AMERICA |
6029 |
4 520 |
3 618 |
37920 |
31 857 |
| AUSTRALASIA |
11759 |
11 369 |
10 136 |
81821 |
73 203 |
| ASIA |
27711 |
29 767 |
21 584 |
219135 |
155 209 |
| MIDDLE EAST |
7643 |
7 697 |
4 966 |
47395 |
33 944 |
| OVERSEAS TOTAL |
200901 |
203 421 |
165 990 |
1574470 |
1 315 243 |
| TOTAL AFRICA |
618292 |
629 348 |
562 257 |
5043294 |
4 447 897 |
| GRAND TOTAL |
822416 |
833 638 |
731 248 |
6625141 |
5 771 364 |
Table 2 shows that all South Africa’s major overseas markets performed well in August 2016. Amongst traditional overseas markets, the USA grew by 18.6%, while Germany increased by 20.7% and the UK by 11.5% from January-August 2016. Non-traditional source markets also experienced high growth during the same period, such as China (64.1%) and India (27%).
Table 2: South Africa's Top 20 Source Markets: August 2016 compared to August 2015
| | August 2015 | | August 2016 | | | | Rank | Country | Tourist Arrivals | Country | Tourist Arrivals | Rank | | 1 | Zimbabwe | 140931 | Zimbabwe | 188750 | 1 | | 2 | Lesotho | 120861 | Lesotho | 137465 | 2 | | 3 | Mozambique | 105096 | Mozambique | 98537 | 3 | | 4 | Swaziland | 81679 | Swaziland | 80598 | 4 | | 5 | Botswana | 47027 | Botswana | 47875 | 5 | | 6 | UK | 28540 | UK | 31351 | 6 | | 7 | USA | 26635 | USA | 29474 | 7 | | 8 | Namibia | 18482 | Germany | 18792 | 8 | | 9 | Germany | 15993 | Namibia | 17334 | 9 | | 10 | Zambia | 12130 | Netherlands | 14669 | 10 | | 11 | Malawi | 10735 | Malawi | 14410 | 11 | | 12 | Netherlands | 9774 | Zambia | 14317 | 12 | | 13 | France | 9685 | France | 12693 | 13 | | 14 | Italy | 8704 | China (including Hong Kong) | 11933 | 14 | | 15 | Australia | 8529 | Italy | 11198 | 15 | | 16 | China (including Hong Kong) | 7183 | Australia | 9518 | 16 | | 17 | India | 6126 | India | 7299 | 17 | | 18 | Nigeria | 5241 | Nigeria | 6494 | 18 | | 19 | Spain | 4038 | Spain | 6117 | 19 | | 20 | Angola | 4021 | Belgium | 4095 | 20 |
For August 2016, Zimbabwe and the UK were the largest African and overseas source markets for South Africa respectively, maintaining the same trend of August 2015. Compared to August 2015, Germany moved from the 9th to 8th source market, replacing Namibia. The Netherlands replaced Zambia by becoming South Africa's 10th source market from the 12th position. Moreover, China (including Hong Kong) replaced Italy, becoming South Africa's 14th source market, and Belgium entered the top 20 source markets. For overseas markets, the highest increase in tourist arrivals was from China (66.1%) with a record of 11933 tourist arrivals in August 2016 compared to 7183 in August 2015.
Although Saudi Arabia does not fall in the top 20 source markets, it experienced an additional 1602 tourists visiting South Africa in August 2016, from 684 in August 2015 to 2286 tourists in August 2016
Nov-Jan2017
SUMMARY ANALYSIS: NOVEMBER 2016
TOTAL TOURIST ARRIVALS
A total of 809 349 tourist arrivals were recorded for November 2016, which is an increase of 4.5% (34 971 tourists) compared to the same month of the previous year (see figure 1 below). However, there was a decrease of 41 607 tourists (a percentage decline of 4.9%) in November 2016 compared to October 2016. This brings the total tourist arrivals for the period January-November 2016 to 9 079 056, which is an increase of 13.3% (1 068 003) compared to the same period of the previous year.
Figure 1: Total Tourist Arrivals Jan-Nov 2016 vs. Jan-Nov 2016 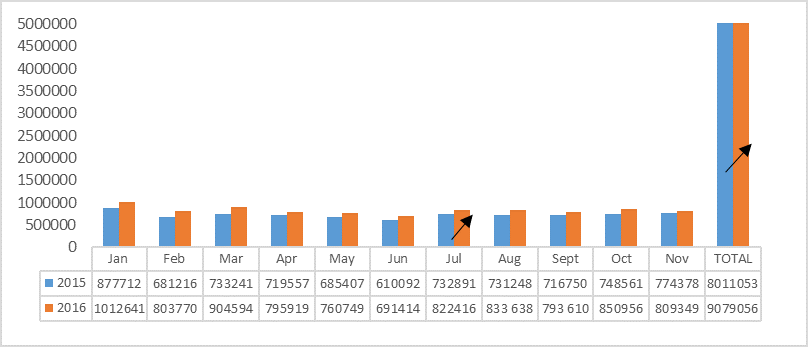
Comparing November 2016 to October 2016 (refer to Table 1), only Europe experienced an increase by of 2.1% in tourist arrivals compared to all other regions, while Australasia experienced the highest decline of 3.7%. When comparing November 2016 to November 2015, an increase in tourist arrivals is evident for most regions with an exception of Australasia and Asia. Central and South America increased by 77.8%, followed by Middle East (34.3%), Europe (16.2%), North America (4.9%) and Africa (1.1%). For total Africa Air, there was an increase of tourist arrivals from 25 144 to 34 751, an increase of 38.2%. An increase in tourist arrivals is also recorded for all regions when comparing the period January-November 2016 to January-November 2015. Middle East increased by 37.1%, Asia (32.8%), Central and South America (28.3%), Europe (16.6%), North America (15.6%), Australasia (11.6%) and Africa (11.6 %.)
TOURIST MARKETS
Table 1: Total Tourist Arrivals by Region November 2016
|
November 2016 compared to
October 2016
|
|
November 2015 Compared to November 2016
|
Jan-Nov 2016 compared to Jan-Nov 2015
|
|
|
Region |
October
2016
|
November
2016
|
November
2015
|
Jan-Nov 2016 |
Jan-Nov 2015 |
| EUROPE |
164700 |
168222 |
144788 |
1358663 |
1165497 |
| NORTH AMERICA |
33418 |
32306 |
30794 |
368044 |
318336 |
| CENTRAL & SOUTH AMERICA |
7249 |
7157 |
4025 |
58232 |
45394 |
| AUSTRALASIA |
10311 |
8894 |
8986 |
115888 |
103802 |
| ASIA |
28814 |
27411 |
28069 |
303901 |
228877 |
| MIDDLE EAST |
6245 |
6027 |
4 487 |
66594 |
48 559 |
| OVERSEAS TOTAL |
250737 |
250017 |
221 149 |
2271322 |
1 910 465 |
| TOTAL AFRICA AIR
(Africa Air+ Indian Oceans Islands+ Middle East) |
34937 |
34751 |
25144 |
273143 |
259378 |
| TOTAL AFRICA
(Total Africa Land+ Africa Air+ Indian Ocean Islands) |
599180 |
558139 |
551927 |
6797215 |
6088827 |
| GRAND TOTAL |
850956 |
809349 |
774378 |
9079056 |
8011053 |
Table 2 below shows that all South Africa's major overseas markets performed well in November 2016. For the period Jan-Nov 2016 compared to Jan-Nov 2015, there was growth evident for the traditional overseas markets. The USA grew by 16.8%, Germany and the UK by 22.2% and 11.8% respectively. During the same period, non-traditional source markets like China and India also experienced high growth of 42.7% and 23.3% respectively.
Table 2: South Africa's Top 20 Source Markets: November 2016 vs. November
| | November 2015 | | November 2016 | | | | Rank | Country | Tourist Arrivals | Country | Tourist Arrivals | Rank | | 1 | Zimbabwe | 145854 | Zimbabwe | 145913 | 1 | | 2 | Lesotho | 122578 | Lesotho | 122185 | 2 | | 3 | Mozambique | 98003 | Mozambique | 97108 | 3 | | 4 | Swaziland | 67509 | Swaziland | 67379 | 4 | | 5 | Botswana | 47802 | Botswana | 52739 | 5 | | 6 | UK | 35641 | Germany | 42489 | 6 | | 7 | Germany | 35370 | UK | 40086 | 7 | | 8 | USA | 24429 | USA | 26847 | 8 | | 9 | Namibia | 16862 | France | 19531 | 9 | | 10 | France | 15103 | Namibia | 15730 | 10 | | 11 | Netherlands | 13340 | Netherlands | 15726 | 11 | | 12 | Zambia | 13113 | Zambia | 14478 | 12 | | 13 | China (including Hong Kong) | 12548 | Malawi | 13937 | 13 | | 14 | Malawi | 12479 | China (including Hong Kong) | 10884 | 14 | | 15 | India | 7767 | Australia | 7421 | 15 | | 16 | Australia | 7539 | India | 7367 | 16 | | 17 | Switzerland | 6739 | Switzerland | 7192 | 17 | | 18 | Canada | 6365 | Sweden | 6089 | 18 | | 19 | Belgium | 4877 | Canada | 5459 | 19 | | 20 | Sweden | 4782 | Nigeria | 5165 | 20 |
For the Africa source markets, Zimbabwe remained the largest African source market, and Nigeria moved into the top twenty countries' list in November 2016 (see Table 2). For the Overseas markets, Germany moved a position up replacing UK as the largest overseas market for South Africa. The highest increase in tourist arrivals from traditional overseas markets was from France (4428, equivalent to 29.3%), when comparing November 2016 to the same period last year. Belgium dropped its position in the top twenty countries' list, while Nigeria entered the list at position 20.
Sep-Nov2016
SUMMARY ANALYSIS: SEPTEMBER 2016
TOTAL TOURIST ARRIVALS
A total of 793 610 tourist arrivals were recorded for September 2016, which is an increase of 10.7% (76 860) compared to the same month of the previous year (refer to figure 1 below). There was a decrease 40 028 tourists in September 2016 compared to August 2016. This brings the total tourist arrivals for the period January-September 2016, to 6 625 141, which is an increase of 14.3% (930 637) compared to the same period of the previous year.
Figure 1: Total Tourist Arrivals Jan-Sept 2015 versus Jan-Sept 2016 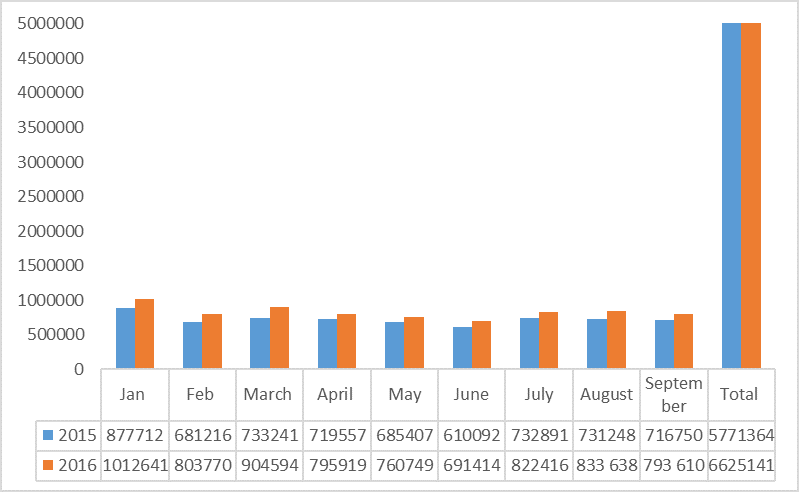
Table 1 below shows that all regions experienced a decline in tourist arrivals when comparing September 2016 to August 2016 therefore there was a decline of 4.8% (40028) in total tourist arrivals. When comparing September 2016 with September 2015, an increase in tourist arrivals is evident for all regions: Australasia increased by 25.6%, followed by Asia (25.2%), Central and South America (23.2%), North America (18.4%) Europe (15.2%) and Middle East (14.2%). The least increase was recorded in Total Africa (8.5%). For total Africa Air there was an increase of 2.7% moving from 32531 to 31690 tourist arrivals. Interestingly, an increase in tourist arrivals is also recorded for all regions when comparing the period January-September 2016 with January-September 2015. Asia increased by 39.1%, Middle East (35.8%), Central and South America (19.6%), North America (17.9%), Total Africa (12.9%). For this period, there was an increase of 10.8% for total Africa moving from 267407 to 296228 tourist arrivals.
TOURIST MARKETS
Table 1: Total Tourist Arrivals by Region September 2016
| |
August 2016 compared to September 2016
|
|
September 2015 Compared to September 2016
|
Jan-September2016 compared to Jan-September 2015
|
|
|
Region |
|
September
2016
|
September
2015
|
Jan-September 2016 |
Jan-September 2015 |
| EUROPE |
116 643 |
105035 |
91143 |
1025741 |
885216 |
| NORTH AMERICA |
33 425 |
34827 |
29411 |
302320 |
256368 |
| CENTRAL & SOUTH AMERICA |
4 520 |
5906 |
4794 |
43826 |
36654 |
| AUSTRALASIA |
11 369 |
14862 |
11834 |
96683 |
85037 |
| ASIA |
29 767 |
28541 |
22804 |
247676 |
178013 |
| MIDDLE EAST |
7 697 |
6927 |
6064 |
54322 |
40008 |
| OVERSEAS TOTAL |
203 421 |
196098 |
166053 |
1770568 |
1481296 |
| TOTAL AFRICA AIR
(Africa Air+ Indian Oceans Islands Middle East) |
37 759 |
32531 |
31690 |
296228 |
267407 |
| TOTAL AFRICA
(Total Africa Land+ Africa Air+ Indian Ocean Islands) |
629 348 |
596 548 |
549 625 |
5639842 |
4997522 |
| GRAND TOTAL |
833 638 |
793 610 |
716 750 |
7418751 |
6488114 |
Table 2 shows that all South Africa's major overseas markets performed well in September 2016. Amongst traditional overseas markets, the USA grew by 18.6%, while Germany increased by 21.2% and the UK by 11.4% from Jan-September 2016. Non-traditional source markets like China (58%) and India (26.6%) also experienced high growth during the same period.
Table 2: South Africa's Top 20 Source Markets: September 2016 compared to September 2015
| | September 2015 | | September 2016 | | | | Rank | Country | Tourist Arrivals | Country | Tourist Arrivals | Rank | | 1 | Zimbabwe | 151454 | Zimbabwe | 152264 | 1 | | 2 | Lesotho | 107998 | Lesotho | 137932 | 2 | | 3 | Mozambique | 99730 | Mozambique | 94207 | 3 | | 4 | Swaziland | 66065 | Swaziland | 75374 | 4 | | 5 | Botswana | 56983 | Botswana | 65440 | 5 | | 6 | UK | 26438 | USA | 29947 | 6 | | 7 | USA | 25191 | UK | 29366 | 7 | | 8 | Germany | 18375 | Germany | 23085 | 8 | | 9 | Namibia | 16590 | Namibia | 16636 | 9 | | 10 | Zambia | 13043 | Zambia | 14634 | 10 | | 11 | Malawi | 12136 | Malawi | 14457 | 11 | | 12 | Australia | 10086 | Australia | 12511 | 12 | | 13 | Netherlands | 9168 | Netherlands | 11808 | 13 | | 14 | China (including Hong Kong) | 8276 | China (including Hong Kong) | 10182 | 14 | | 15 | France | 8214 | France | 8673 | 15 | | 16 | India | 6274 | India | 7727 | 16 | | 17 | Nigeria | 5427 | Canada | 4880 | 17 | | 18 | Italy | 4693 | Nigeria | 4673 | 18 | | 19 | Canada | 4220 | Italy | 4669 | 19 | | 20 | Angola | 3898 | Switzerland | 3767 | 20 |
For the Africa source markets, Zimbabwe remained the largest African source market while Nigeria dropped from 17th place in September 2015 to 18th place in September 2016. For the Overseas markets, the USA replaced UK as the largest overseas source market for South Africa while Switzerland moved to the top 20 source markets in September 2016. The highest increase in tourist arrivals from traditional overseas markets was Germany (25.6%) moving from 18 375 in September 2015 to 23 085 in September 2016.
Jun-Aug2016
SUMMARY ANALYSIS JUNE 2016
TOTAL TOURIST ARRIVALS
A total of 691 414 tourist arrivals were recorded for June 2016, which is an increase of 13.3% (81 322) compared to the same month of the previous year (refer to figure 1 below). There was a decrease of 69 335 tourists in June 2016 compared to May 2016. This brings the total tourist arrivals to 4 969 088 for the period January-June 2016, which is an increase of 15.4% (66 182) compared to the same period of the previous year.
Figure 1: Total Tourist Arrivals Jan-June 2015 versus Jan 2016 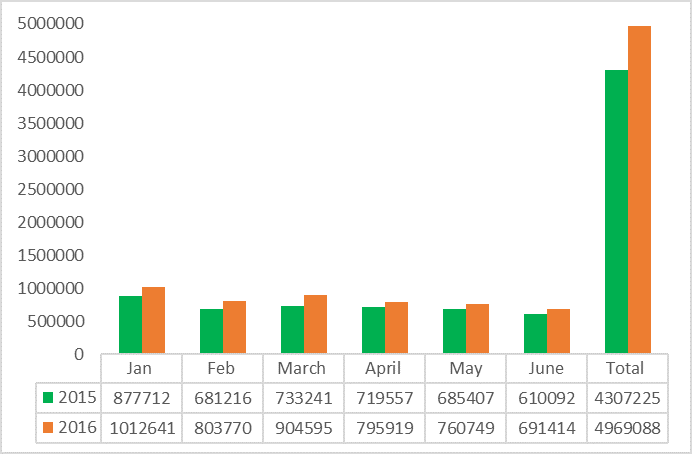
Table 1 below shows that all regions except Australasia experienced a decrease in tourist arrivals in June 2016 compared to May 2016. When comparing June 2016 with June 2015, an increase in tourist arrivals for all regions is evident. Asia increased by 52.9%, followed by North America (17.7%), Central and South America (16.7%), Total Africa including Indian Ocean Islands (12.1%), Europe (11.7%), and Australasia (11.5%). The least increase was in Middle East (9.8%).
TOURIST MARKETS
Table 1: Total Tourist Arrivals by Region June 2016 compared to May 2016
| |
May 2016 compared to June 2016
|
|
June 2015 Compared to June 2016
|
Jan-June 2016 compared to Jan-June 2015
|
|
|
Region |
May
2016
|
June
2016
|
June
2015
|
Jan-June 2016 |
Jan-June 2015 |
| EUROPE |
74360 |
58104 |
52038 |
697373 |
607892 |
| NORTH AMERICA |
35872 |
34631 |
29421 |
192999 |
164097 |
| CENTRAL & SOUTH AMERICA |
4445 |
3661 |
3136 |
27371 |
23391 |
| AUSTRALASIA |
9325 |
10318 |
9257 |
58693 |
52963 |
| ASIA |
31641 |
25857 |
16915 |
161657 |
114857 |
| MIDDLE EAST |
4984 |
3209 |
2922 |
32055 |
23320 |
| OVERSEAS TOTAL |
160627 |
135780 |
113689 |
1170148 |
986520 |
| TOTAL AFRICA |
598 997 |
554811 |
495143 |
3793492 |
3314486 |
| GRAND TOTAL |
760 749 |
691414 |
610092 |
4969087 |
4307225 |
Table 2 below shows that all South Africa's major overseas markets performed well in June 2016. Amongst traditional overseas markets, the USA has grown by 18.6%, while Germany increased by 20.7% and the UK by 12.7% from Jan-June 2016. Non-traditional source markets like India (40.3%) and China (97.8%) have also experienced the highest growth during the same period. Also interesting to note is the number of tourists from China who almost doubled in June 2016 compared to June 2015.
Table 2: South Africa's Top 20 Source Markets: June 2016 compared to June 2015
| | June 2015 | | June 2016 | | | | Rank | Country | Tourist Arrivals | Country | Tourist Arrivals | Rank | | 1 | Zimbabwe | 138502 | Zimbabwe | 144865 | 1 | | 2 | Lesotho | 102880 | Lesotho | 142402 | 2 | | 3 | Mozambique | 93697 | Mozambique | 91574 | 3 | | 4 | Swaziland | 62160 | Swaziland | 66459 | 4 | | 5 | Botswana | 39707 | Botswana | 48076 | 5 | | 6 | USA | 26503 | USA | 31286 | 6 | | 7 | UK | 17897 | UK | 18233 | 7 | | 8 | Namibia | 13845 | Namibia | 14036 | 8 | | 9 | Zambia | 13234 | Zambia | 13815 | 9 | | 10 | Malawi | 9736 | Malawi | 11422 | 10 | | 11 | Australia | 7682 | India | 9228 | 11 | | 12 | Germany | 6983 | Australia | 8626 | 12 | | 13 | India | 6577 | Germany | 8625 | 13 | | 14 | France | 5112 | China (including Hong Kong) | 8255 | 14 | | 15 | Nigeria | 4462 | France | 5792 | 15 | | 16 | Netherlands | 4256 | Nigeria | 5171 | 16 | | 17 | China (including Hong Kong) | 4174 | Netherlands | 5076 | 17 | | 18 | Italy | 2922 | Canada | 3345 | 18 | | 19 | Canada | 2918 | Italy | 3290 | 19 | | 20 | Tanzania | 2756 | Tanzania | 2763 | 20 |
For June 2016 and 2015, Zimbabwe remains the largest African source market and the USA the largest overseas source market for South Africa. Compared to June 2015, countries from the Asia region performed better than those from Europe. India replaced Australia by moving from 13th place to become South Africa's 11th source market resulting in India becoming the third biggest overseas source market to South Africa in June 2016. China (including Hong Kong) replaced France and moved from 17th to 14th place. Germany dropped from 12th to 13th place and Netherlands from 16th to 17th position. Canada has moved from 19th to 18th position, replacing Italy as a source market for South Africa.
|
|
|
|
|
|